You are here
Science Resources: Water and the Law
What Is Water Quality?
Water quality is a quantification of the ability of a water source to meet the chemical, biological, and physical requirements of a specific water use. No water is completely “pure”: scientists and environmental engineers define water quality as meeting relative thresholds for specific use. These uses are not just human-centric; they also include instream environmental requirements for biologically diverse and resilient aquatic ecosystems.
The default water quality standard for surface waters covered by the CWA is “fishable and swimmable,” meaning that these waters need to pose no harm to human health through direct contact or indirect ingestion [1]. Many states set alternative uses (and corresponding standards) for waters within their boundaries that are either more or less strict than this default. When a waterbody fails to meet these standards, it is considered impaired, and states must define and implement a plan to bring the water into compliance [2]. Measuring water quality is thus important in defining the required level of treatment to bring a source in line with its intended use.
Physical Characteristics
- Turbidity evaluates the “cloudiness” of the water. It can be caused by a variety of factors, including small particles of suspended clays and silts, dissolved organic compounds, and algae, zooplankton, and other microorganisms. Turbidity can vary significantly based on the flow rate of the waterbody at the time of measurement. During times of low flow, turbidity is typically low. During storm events, rain causes erosion from the surrounding land area and the higher velocities in the river lead to a churning of sediment from the riverbed, resulting in increased turbidity. Turbidity can adversely impact aquatic ecosystems by reducing the amount of sunlight penetrating the waterbody. From a human health perspective, the suspended particles that produce high turbidity can provide attachment sites for heavy metals and bacteria [3]. Higher turbidity caused by algal blooms can be toxic to humans and animals and decreases dissolved oxygen.
- Total suspended solids (TSS) is a physical quality closely tied to turbidity. It measures the amount of insoluble particulate matter in a particular quantity of water (particles over 2 microns in diameter). The effects of TSS on human health are similar to those of turbidity. TSS also increases the temperature of the water, thereby decreasing its dissolved oxygen content [4].
- Dissolved oxygen (DO) is a physical measure of the amount of oxygen currently dissolved in the water. DO is impacted by chemical, physical, and biological properties. Cooler water has the ability to carry more DO than warmer water. Rapidly moving water typically has a higher DO content than stagnant water [5]. Furthermore, deep lakes can be prone to thermal stratification, especially during warm summer months but also during the winter if the lake is ice-covered. If the stratification is strong enough to negate mixing by the wind, oxygen that diffuses into surface waters from the atmosphere never reaches the bottom of the lake, resulting in a zone of low DO [6]. Additionally, in productive, mesotrophic to hypertrophic lakes the decomposition of decaying organic matter at the bottom of the lake consumes DO and further reduces DO concentrations at the bottom of the lake. DO is a good indicator of the overall health of a waterbody because fish and other aquatic species rely on DO for their survival. For example, according to the Michigan Department of Environmental Quality, cold-water fish need a minimum DO concentration of 7 milligrams per liter to thrive, and warm water fish require 5 milligrams per liter [6]. DO levels below 2 milligrams per liter can lead to a condition called hypoxia and large-scale loss of aquatic life [7].
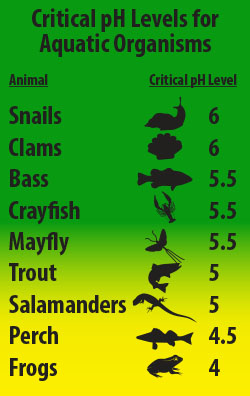
Temperature, flow, and pH are all important “secondary” characteristics (as defined by the SDWA) that are typically measured when assessing water quality. Although they do not on their own directly impact human health, all three parameters impact other chemical and physical characteristics such as turbidity and DO. Moreover, all three parameters are important in maintaining the overall health of aquatic ecosystems. Low soil pH in a watershed (caused, for example, by acid rain) can lead to leaching of aluminum from soil clay particles into lakes and streams, as well as mass die-offs of fish eggs and pH-sensitive plants and insects [8].
Chemical Characteristics
Many types of chemical contaminants pose significant health risks. The U.S. Environmental Protection agency (USEPA) has identified 126 priority pollutants, to create practical testing and regulation guidance for the broader toxic pollutants list required by Section 307(a)(1) of the CWA [9]. These pollutants include toxins from pesticides and herbicides, volatile organic compounds such as benzene, mining by-products such as cyanide, polychlorinated biphenyls (PCBs), and multiple heavy metals.
This section covers the three most common classes of chemical contamination: COD/BOD, heavy metals, and nutrients.
Chemical Oxygen Demand (COD) measures the amount of oxygen required to chemically decompose organic compounds in water. Similarly, Biological Oxygen Demand (BOD) is the amount of oxygen required by microorganisms like algae and bacteria to break down organic matter in water. BOD is therefore considered a proxy for organic pollutants. Both COD and BOD are temperature-specific: in general, warmer temperatures speed up both bacterial metabolism and chemical reactions, increasing BOD and COD. Waterbodies with high levels of COD and BOD will likely also have low DO. COD/BOD are thus excellent general water quality indicators, particularly for waterbodies known to be contaminated with wastewater or agricultural runoff.
Organic material in sources of drinking water poses another challenge. In a drinking water treatment plant, water is treated with a disinfectant before being released into the municipal distribution network. In many systems, chlorine is the disinfectant of choice because it is effective and cheap and provides some residual protection for the water in the pipes after it leaves the plant. However, chlorine can also react with organic materials to form a series of carcinogenic compounds known as disinfection byproducts (DBPs). DBPs can be mitigated in drinking water systems by using treatments like activated carbon or by switching to an alternative disinfectant like chloramine. However, source control of COD/BOD remains an effective method of reducing this risk altogether [10].
Heavy metals are a particular concern for waterbodies that are sources of drinking water or are commonly used for recreational or commercial fishing. Metals such as lead, cadmium, nickel, and mercury are particularly dangerous because they are bioaccumulative, meaning that concentrations of the metal can build up in the bodies of fish and other aquatic organisms over time [11].
Mercury is a contaminant of concern tracked by USEPA’s National Aquatic Resource Surveys (NARS), an ongoing statistical study designed to track changes in the quality of U.S. waters. In particular, NARS tracks sediment mercury, the form of the metal that has settled to the bottom of waterbodies and been integrated into bottom substrates [12]. Bacteria can ingest and transform sediment mercury into the more bioavailable methylmercury. This chemical is a potent neurotoxin and is especially dangerous to developing fetuses and young children. Methylmercury poisoning is of greatest concern in areas where people might ingest contaminated shellfish or fish. For this reason, many studies also track mercury concentrations in fish tissues [11].
Nutrients are key elements that all life needs to grow and thrive. Among the most important are nitrogen and phosphorus, used by plants to promote the healthy growth of leaves, roots, and seeds as well as DNA. However, excess nutrients in waterways can promote excessive algae growth in rivers, lakes, and oceans. These algal blooms can have significant impacts on aquatic and human health. Both nitrogen and phosphorus take a variety of forms in the environment, which affects their solubility in water and how they are transported. These forms are often referred to as “species” in the scientific literature.
Phosphorus can be found in three main forms:
- Organic phosphorus. Organic phosphorus is phosphorus that is bound up in the bodies of plants and animals and in humus, the layer of the soil composed of dead and decaying plant matter. Organic phosphorus is insoluble.
- Inorganic soluble phosphorus. Organic phosphorus can be transformed by microbes in the soil into inorganic soluble phosphorus (orthophosphates) through a process called mineralization. This process is reversible (the corresponding biological process that transforms orthophosphates back into organic phosphorus is known as immobilization). Soluble phosphorus is important because it is the primary form in which plants can uptake phosphorus through their root systems. For this reason, orthophosphates are the form of phosphorus found in most artificial fertilizers.
- Insoluble phosphorus. Soluble phosphorus can adsorb onto minerals in the soil such as clays, iron and aluminum oxides, and carbonates (the reverse process is known as desorption). This form of phosphorus is insoluble; it can be washed into rivers and streams along with sediments from farm fields and roadways. Soluble phosphorous can also be converted into insoluble phosphorous by the inorganic precipitation of Ca-phosphate, Fe-phosphate, and Al-phosphate minerals. While the solubility of phosphorous is not affected by oxidation state, Ca, Fe, and Al become less soluble with higher concentrations of oxygen. Thus, when a lake becomes mixed or unstratified, the conversion of soluble to insoluble phosphorous increases via both adsorption and mineral precipitation.
Depending on the type of waterbody, scientists may measure either or both dissolved phosphorus (DP) or total phosphorus (TP) to evaluate water quality [13].
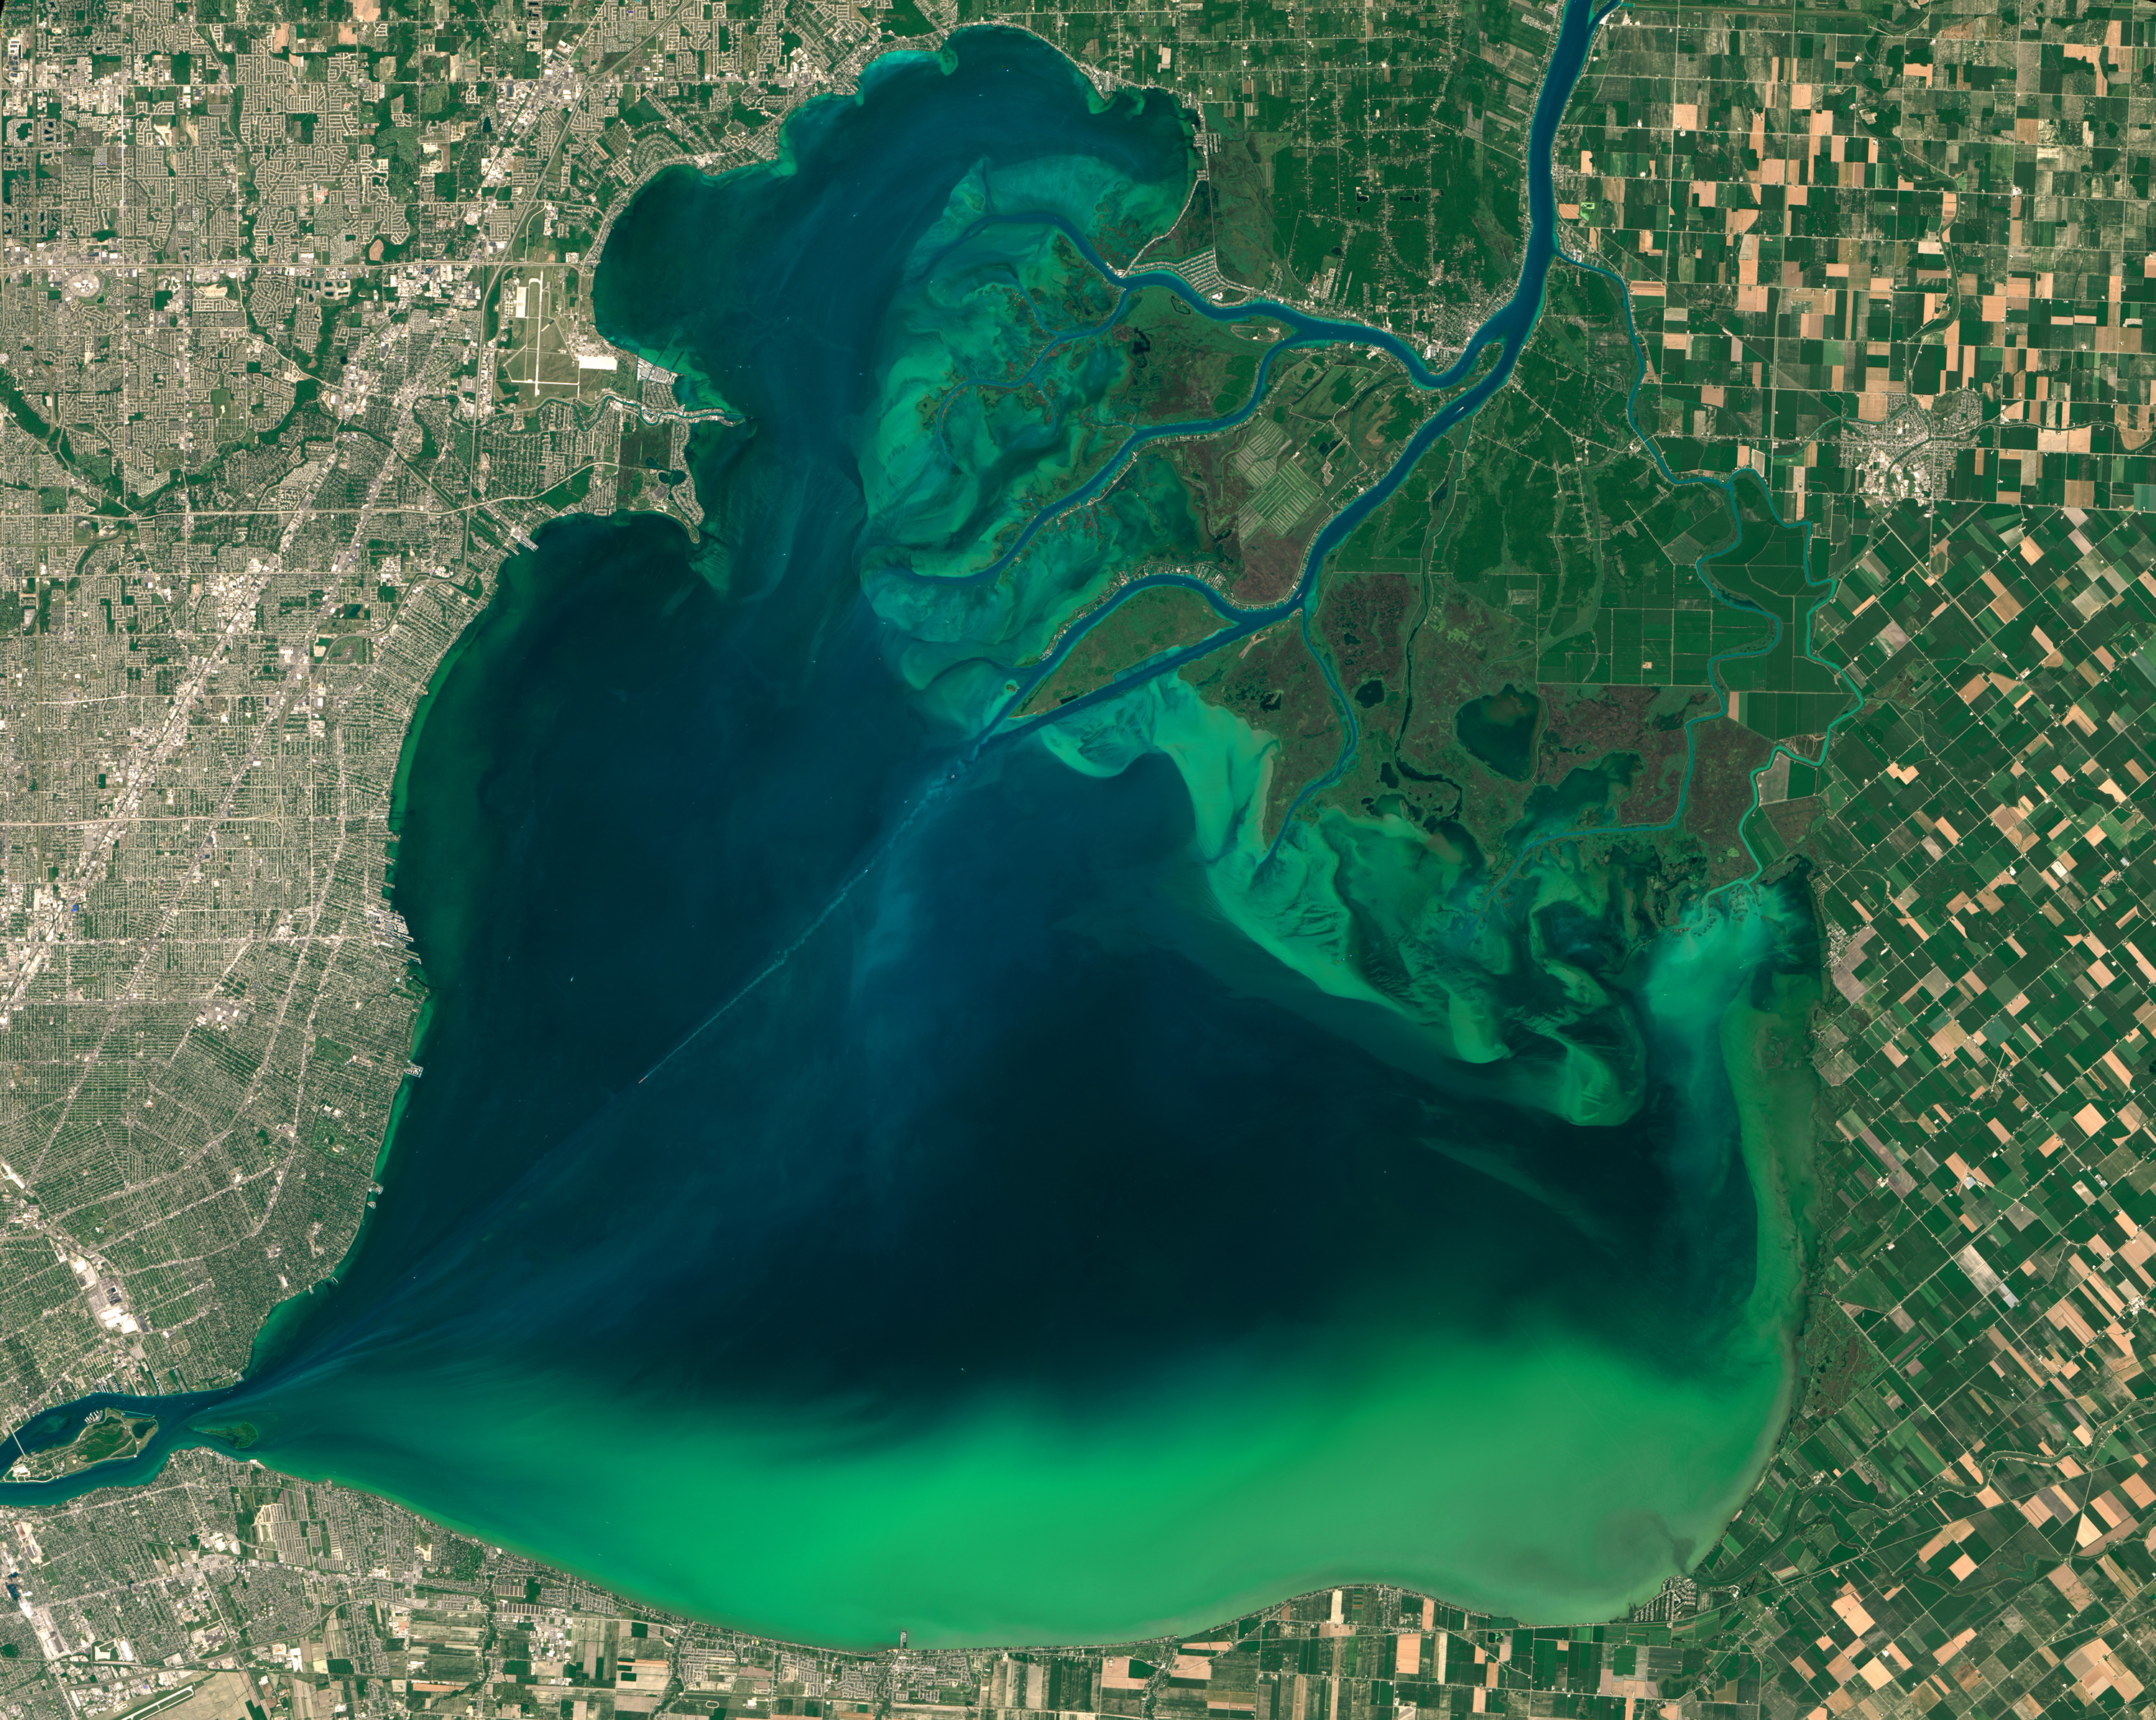
Phosphorus is typically considered the limiting nutrient for the growth of algae in freshwater bodies. A limiting nutrient is the chemical that caps the biological growth of a given species—it is the nutrient available in the least quantity in the surrounding environment, where all other nutrients are abundant. Algae require between ten to forty times as much nitrogen as phosphorus to grow. However, cyanobacteria (known colloquially as bluegreen algae) have the ability to “fix” nitrogen from the atmosphere as part of their metabolic processes [14] [15]. In freshwater systems, scientists view excess phosphorus as the main driver of eutrophication and harmful algal blooms (HABs) [16]. Eutrophication (which can be caused by both HABs and nontoxic algae) can create hypoxic dead zones in lakes and coastal waters [17]. In addition, toxic cyanobacteria blooms can release a mélange of toxins into waterbodies, including microcystin, a poison that if ingested can lead to liver failure and death. Uncontrolled algal blooms impact aquatic ecosystems by blocking out the sunlight necessary for photosynthesis.
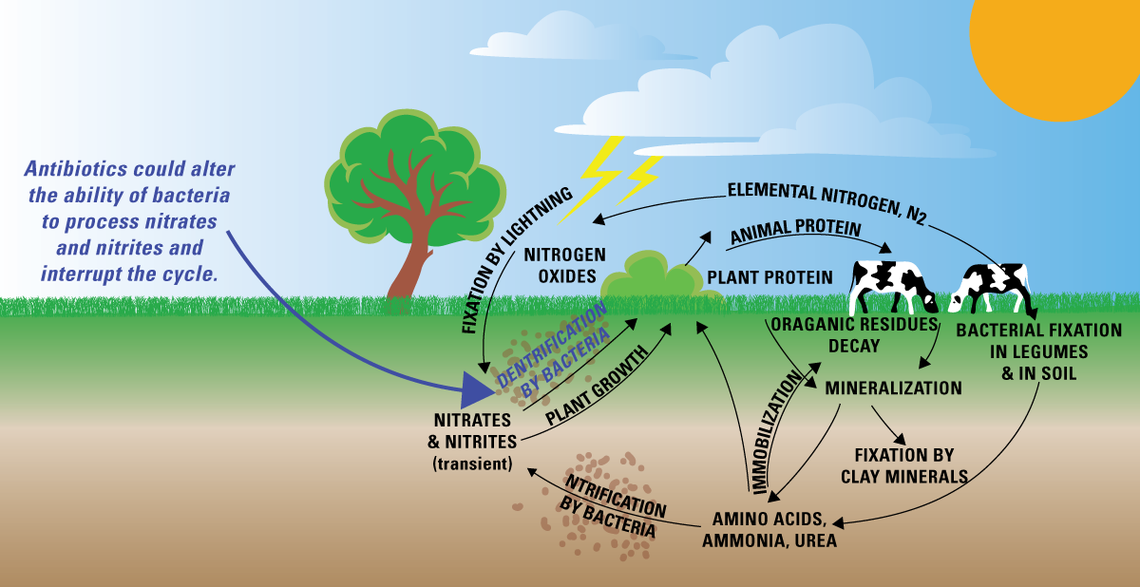
Nitrogen can take on a variety of different species in the environment, including nitrogen gases (ammonia and nitrogen), soluble inorganic nitrogen, and insoluble organic nitrogen. By mass, more than 90 percent of all soil nitrogen is organic nitrogen and unavailable for plant uptake. Different processes take place under different environmental conditions: some reactions favor aerobic (microorganisms have access to oxygen) conditions, while others favor anaerobic (no or low oxygen) conditions. Nitrogen moves through these different species through a range of biochemical processes [18]:
- Fixation: some soil microbes, algae, and plants known as legumes can convert atmospheric nitrogen into organic nitrogen.
- Biouptake: bioavailable (soluble) nitrogen in the soil is taken up by plants to promote root growth and the development of fruit and seeds.
- Ammonification: microbes break down organic nitrogen in the soil into ammonia through the process of decomposition.
- Nitrification: in the presence of oxygen, the bacteria Nitrosomonas and Nitrobacter first convert ammonia into nitrite, and then into water-soluble nitrate.
- Denitrification: in the absence of oxygen, certain bacteria convert soluble nitrates into nitrogen gas.
- Anammox (“anaerobic ammonia oxidation”): in the absence of oxygen, certain bacteria can convert ammonia into nitrogen gas. In certain conditions, anammox may exceed denitrification as the primary route for nitrogen loss.
Because of the complex web of nitrogen species and transformations, scientists measure multiple types of nitrogen to understand water quality. Total nitrogen (TN) is the sum of all of the different nitrogen species in the water: ammonium, organically-bonded nitrogen, nitrites, and nitrates. Total Kjehdahl Nitrogen (TKN) measures combined ammonium and organic nitrogen. Depending on the risk factors for the waterbody (i.e., common land uses in the surrounding area, temperature, pH, and DO), separate tests for nitrites, nitrates, and ammonia can be commissioned.
Nitrites and ammonia are especially toxic to fish, with nitrite replacing essential chloride in their bodies and compromising the transport of oxygen around the body. A buildup of ammonia in fish can lead to stress, internal organ damage, and eventually death [19].
Nitrates are the other nutrient responsible for the formation of algal blooms. This is especially true in saline environments, where insoluble phosphorous is more abundant because of the presence of sulfides which react with iron and other metals decreasing the adsorption and insolubility of phosphorous. As a result of the relatively high concentration of insoluble phosphorous in saltwater versus freshwater, nitrogen, not phosphorous, is more often the limiting nutrient for algal blooms in coastal areas such as the Gulf of Mexico [20]. Nitrogen may also play an important role in certain freshwater algal blooms, though the extent of its contribution to bloom size and severity is still being studied [21]. Moreover, scientists have recently discovered that excess nitrogen can contribute to increased HAB toxicity [22]. When directly ingested, nitrates are carcinogenic, can cause thyroid disease, and cause a dangerous condition in infants called methemoglobinemia (“blue baby syndrome”), where nitrates interfere with the distribution of oxygen around the body [23].
Biological Characteristics
Many of the issues related to HABs and eutrophication can be measured directly. Chlorophyll -a is a green pigment produced by algal blooms that can be monitored using satellite imagery, making it a useful proxy for tracking HABs [24]. Microcystin measurements can be recorded directly in affected lakes, or even estimated based on the size of the bloom. Because not all algal blooms release toxins, direct measurements are necessary to allow water resource managers to determine if additional steps need to be taken to prevent drinking water contamination or harm to recreational users of an impacted waterbody [25].
Another important facet of tracking biological contamination is checking for bacteria such as Enterococci or E. coli that are indictors of fecal contamination in water. While Enterococci are not in themselves harmful to humans (and do occur naturally in the environment), large numbers of E.coli suggest the presence of other, potentially harmful viruses, protozoa, and bacteria in the water. Tracking these bacteria provides warning of the need for potential beach closures in recreational areas due to fecal contamination.
[1] R. Percival, C. Schroeder, A. Miller and J. Leape, Environmental Regulation: Law, Science, and Policy, 9th ed., Boston, MA: Aspen Publishing, 2021.
[2] American Bar Association, The Clean Water Act Handbook, 4th ed., M. A. Ryan, ed., Washington, D.C.: ABA Book Publishing, 2018.
[3] United States Geological Survey, “Water Quality Information by Topic,” Nov. 13, 2018. [Online]. Available: https://www.usgs.gov/special-topics/water-science-school/science/water-quality-information-topic. [Accessed June 6, 2022].
[4] United States Environmental Protection Agency, “5.8 Total Solids,” Mar. 6, 2012. [Online]. Available: https://archive.epa.gov/water/archive/web/html/vms58.html. [Accessed June 6, 2022].
[5] United States Environmental Protection Agency, “Indicators: Dissolved Oxygen,” July 7, 2021. [Online]. Available: https://www.epa.gov/national-aquatic-resource-surveys/indicators-dissolved-oxygen. [Accessed June 6, 2022].
[6] Michigan Sea Grant, “Dissolved Oxygen and Lake Stratification,” 2022. [Online]. Available: https://www.michiganseagrant.org/lessons/lessons/by-broad-concept/physical-science/dissolved-oxygen-and-lake-stratification. [Accessed June 6, 2022].
[7] United States Environmental Protection Agency, “Hypoxia 101,” Nov. 16, 2021. [Online]. Available: https://www.epa.gov/ms-htf/hypoxia-101. [Accessed June 6, 2022].
[8] United States Environmental Protection Agency, “Effects of Acid Rain,” Apr. 24, 2022. [Online]. Available: https://www.epa.gov/acidrain/effects-acid-rain. [Accessed June 6, 2022].
[9] United States Environmental Protection Agency, “Toxic and Priority Pollutants Under the Clean Water Act,” July 10, 2021. [Online]. Available: https://www.epa.gov/eg/toxic-and-priority-pollutants-under-clean-water-act. [Accessed June 6, 2022].
[10] D. Sedlak, Water 4.0: The Past, Present, and Future of the World's Most Vital Resource, New Haven, Conn.: Yale University Press, 2015.
[11] J. Wiener, D. Krabbenhoft, G. Heinz and A. Scheuhammer, “Ecotoxicology of mercury,” in Handbook of ecotoxicology, 2nd ed., D. Hoffman, et al., eds., Boca Raton.: Lewis Publishers, 2003, pp. 409–463.
[12] United States Environmental Protection Agency, “Indicators: Sediment Mercury,” July 7, 2021. [Online]. Available: https://www.epa.gov/national-aquatic-resource-surveys/indicators-sediment-mercury. [Accessed June 6, 2022].
[13] C. Hyland, et al., Phosphorus Basics –The Phosphorus Cycle, Ithaca, N.Y.: Cornell University Cooperative Extension, 2005.
[14] J. Pelley, “Scientists debate the best way to tame toxic algal blooms,” C&EN, vol. 94, no. 12, 21 March 2016.
[15] H. Paerl, et al., “Solving Problems Resulting from Solutions: Evolution of a Dual Nutrient Management Strategy for the Eutrophying Neuse River Estuary, North Carolina,” Environmental Science and Technology, vol. 38, no. 11, p. 3068–3073, 2004.
[16] D. Schindler, et al., “Reducing phosphorus to curb lake eutrophication is a success,” Environmental Science & Technology, vol. 50, no. 17, pp. 8923–8929, 2016.
[17] M. Chislock, et al., “Eutrophication: Causes, Consequences, and Controls in Aquatic Ecosystems,” Nature Education Knowledge, vol. 4, no. 4, 2013.
[18] A. Bernhard, “The Nitrogen Cycle: Processes, Players, and Human Impact,” Nature Education Knowledge, vol. 3, no. 10, p. 25, 2010.
[19] United States Environmental Protection Agency, “CADDIS Vol 2: Ammonia,” Mar. 21, 2022. [Online]. Available: https://www.epa.gov/caddis-vol2/ammonia. [Accessed June 6, 2022].
[20] H. Paerl, R. Dennis and D. Whitehall, “Atmospheric Deposition of Nitrogen: Implications for Nutrient Over-Enrichment of Coastal Waters,” Estuaries, vol. 25, no. 4, pp. 677–693, 2002.
[21] H. Paerl, et al., “Controlling Cyanobacterial Blooms in Hypertrophic Lake Taihu, China: Will Nitrogen Reductions Cause Replacement of Non-N2 Fixing by N2 Fixing Taxa?,” PLOS ONE, vol. 9, no. 11, p. e113123, 2014.
[22] J. Jankowiak, et al., “Deciphering the effects of nitrogen, phosphorus, and temperature on cyanobacterial bloom intensification, diversity, and toxicity in western Lake Erie,” Limnology and Oceanography, vol. 64, p. 1347–1370, 2019.
[23] M. Ward, et al., “Drinking Water Nitrate and Human Health: An Updated Review,” International Journal of Environmental Research and Public Health, vol. 15, no. 7, p. 1557, 2018.
[24] United States Environmental Protection Agency, “Indicators: Chlorophyll a,” July 7, 2011. [Online]. Available: https://www.epa.gov/national-aquatic-resource-surveys/indicators-chlorophyll. [Accessed June 6, 2022].
[25] United States Environmental Protection Agency, “Indicators: Algal Toxins (microcystin),” Apr. 13, 2022. [Online]. Available: https://www.epa.gov/national-aquatic-resource-surveys/indicators-algal-toxins-microcystin. [Accessed June 6, 2022].


