
You are here
COVID-19 Data and Trends for Federal Judicial Districts
COVID-19 Data and Trends for Federal Judicial Districts
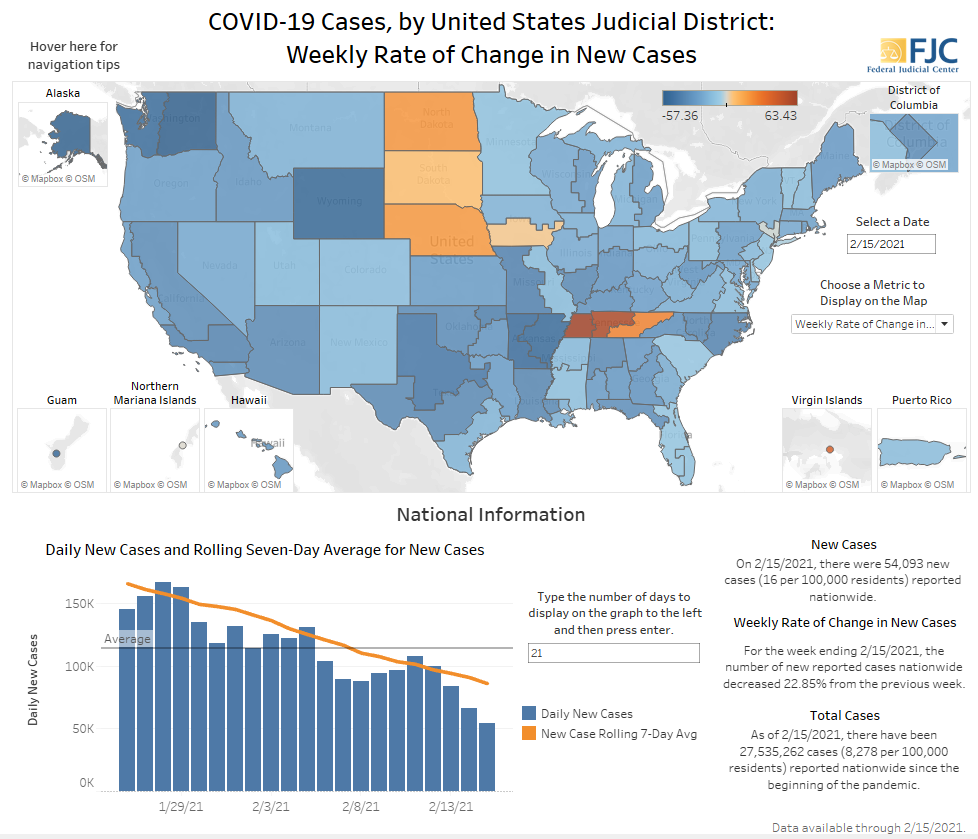
Click on the above image to reach the dashboard.
The Federal Judicial Center (FJC) has created a dashboard showing COVID-19 data and trends for the nation and for each of the ninety-four federal judicial districts. The dashboard shows the number of total cases and daily new cases both as absolute numbers and per 100,000 residents. It also shows the weekly rate of change and rolling seven-day averages for new cases. It includes data on cases since the COVID-19 pandemic began in January 2020 and is updated weekly.
The Information and Instructions document contains a description of the metrics displayed on the dashboard and the underlying data, instructions on how to use the dashboard, and tips on interpreting the displayed information. Please note the data limitations described in the document related to the judicial districts in Connecticut, Guam, Louisiana, Michigan, and Rhode Island.
Click here to access a companion dashboard that shows COVID-19 vaccination rates for the federal judicial districts, and here to access a companion dashboard that shows COVID-19 hospitalization data for the federal judicial districts.
Contact
If you have questions or need more information, please contact Jana Laks, research analyst at the FJC (jlaks@fjc.gov or (202) 502-4252) or Kristin Garri, research associate/data resource specialist at the FJC (kgarri@fjc.gov or (202) 502-4027).