
You are here
COVID-19 Vaccination Percentages in the Federal Judicial Districts
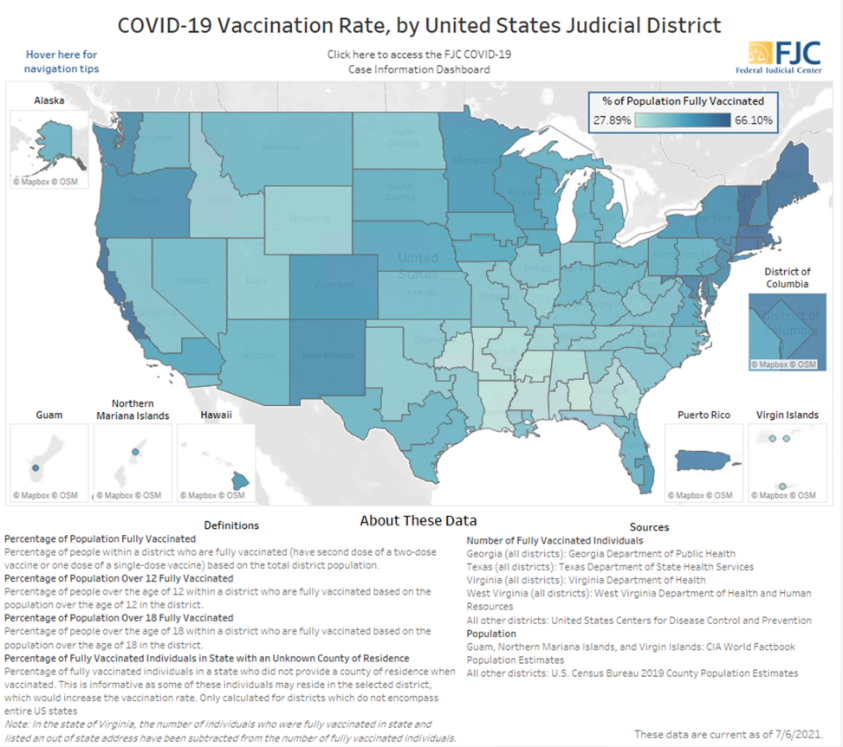
Click on the above image to reach the dashboard.
The Federal Judicial Center (FJC) has created a dashboard showing the percentage of the population that has been fully vaccinated against COVID-19 in each of the ninety-four federal judicial districts. This dashboard is updated every Monday.
The map color-codes districts according to the relative percentage of each district’s population that has been fully vaccinated. The color blue deepens as the percentage increases: dark blue indicates that a district currently has a higher percentage of fully vaccinated individuals relative to other districts.
By hovering over a district, users can also see the percentage of each district’s total population, population over 12 years of age, and population over 18 years of age that are fully vaccinated. For multidistrict states, the percentage of fully vaccinated individuals in the state with an unknown county of residence is also provided. Such individuals may reside in any district in the state, which would increase the vaccination rate of that district.
Click here to access a companion dashboard that shows COVID-19 case data and trends for the federal judicial districts, and here to access a companion dashboard that shows COVID-19 hospitalization data for the federal judicial districts.
Contact
If you have questions or need more information, please contact Jana Laks, research analyst at the FJC (jlaks@fjc.gov or (202) 502-4252) or Kristin Garri, research associate/data resource specialist at the FJC (kgarri@fjc.gov or (202) 502-4027).